We exist to translate complex ideas into clear visuals. We distill dense reports and processes into simple, scannable graphics that your audience actually understands.
Brand-Aligned Storytelling
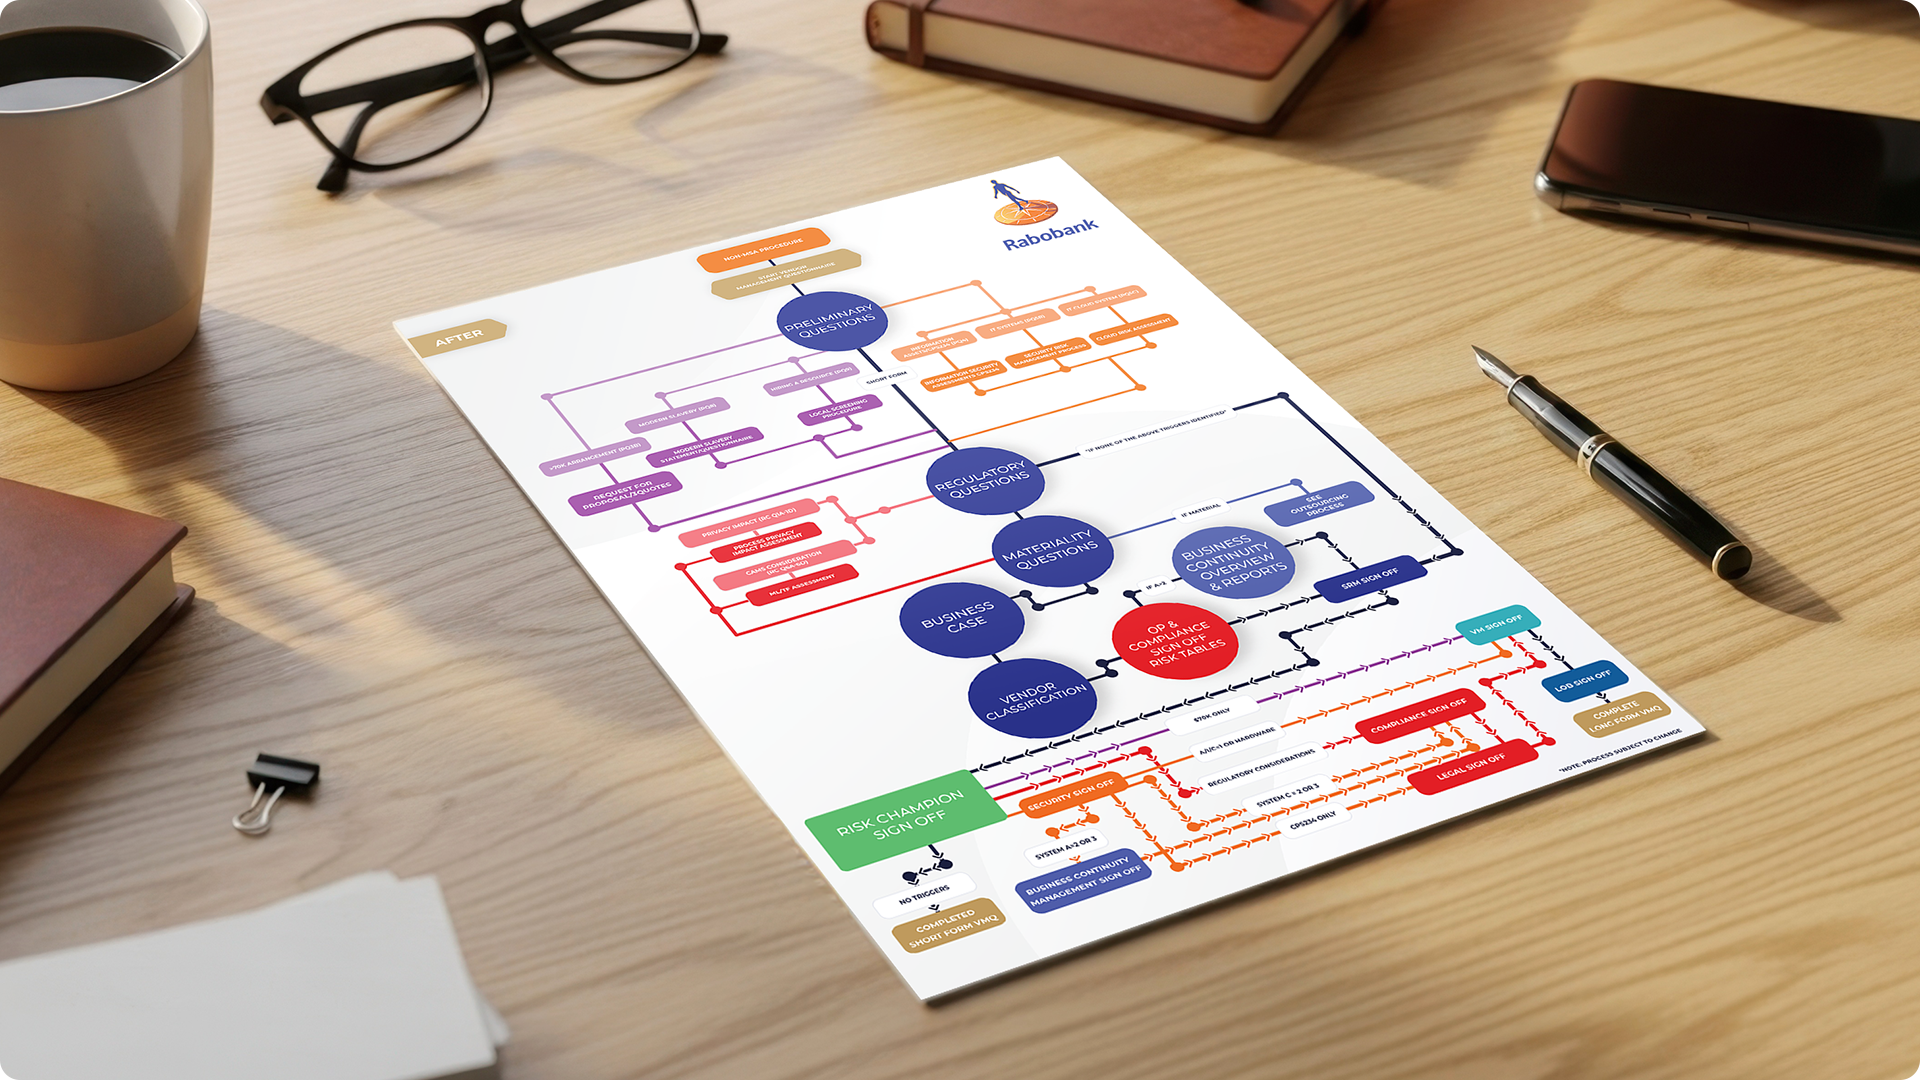
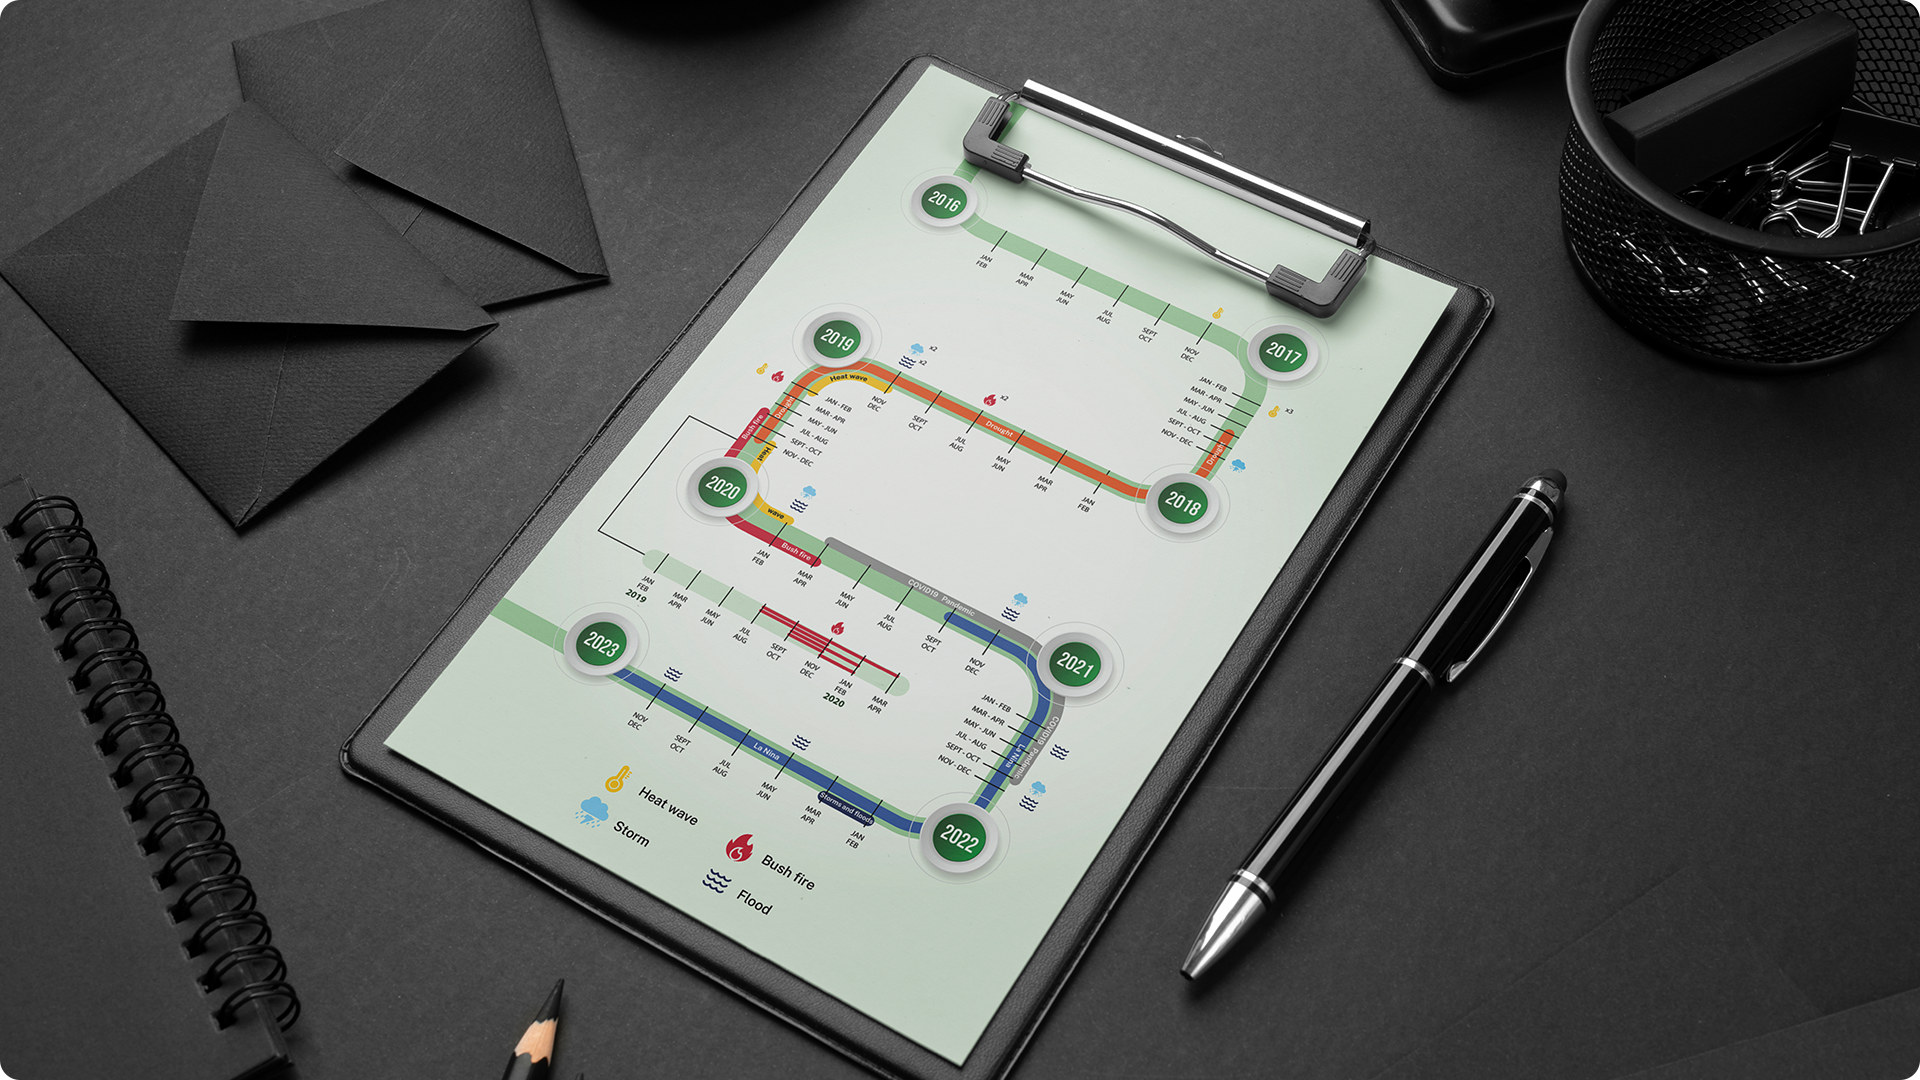
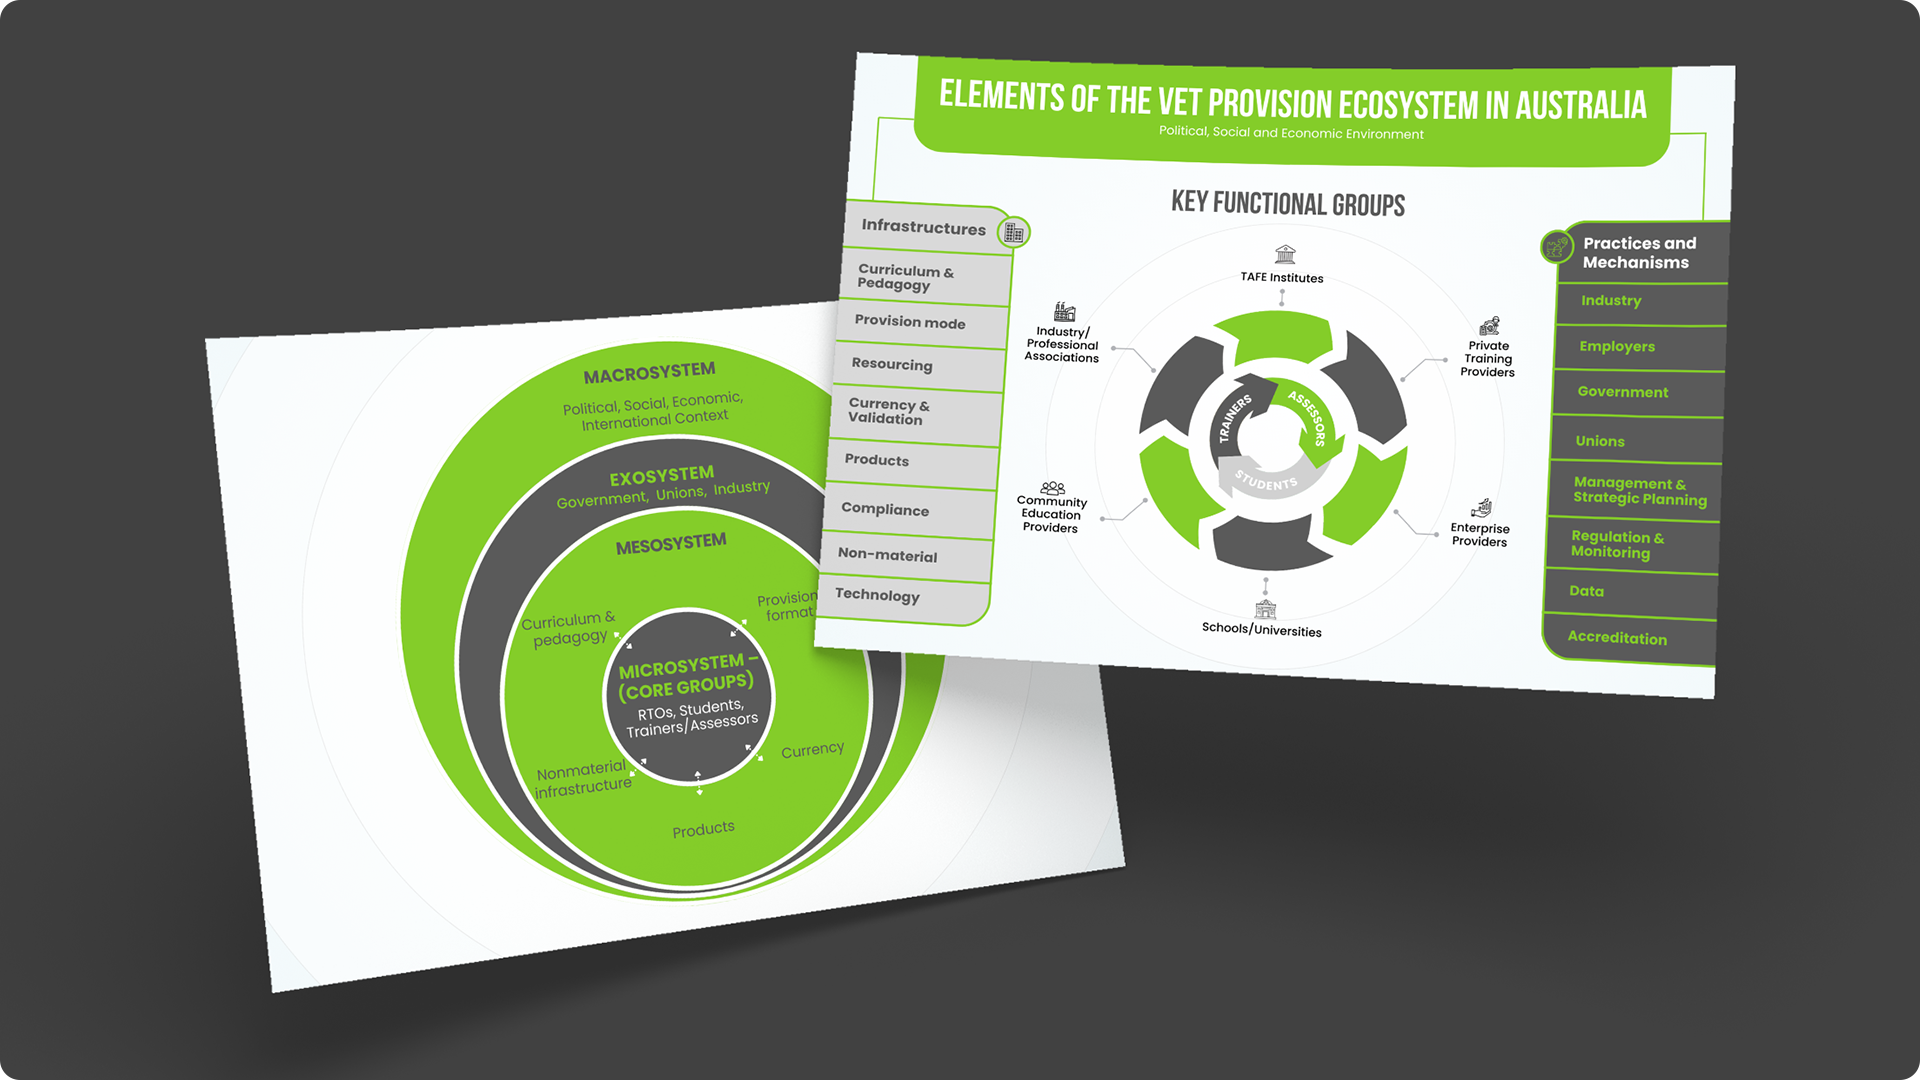
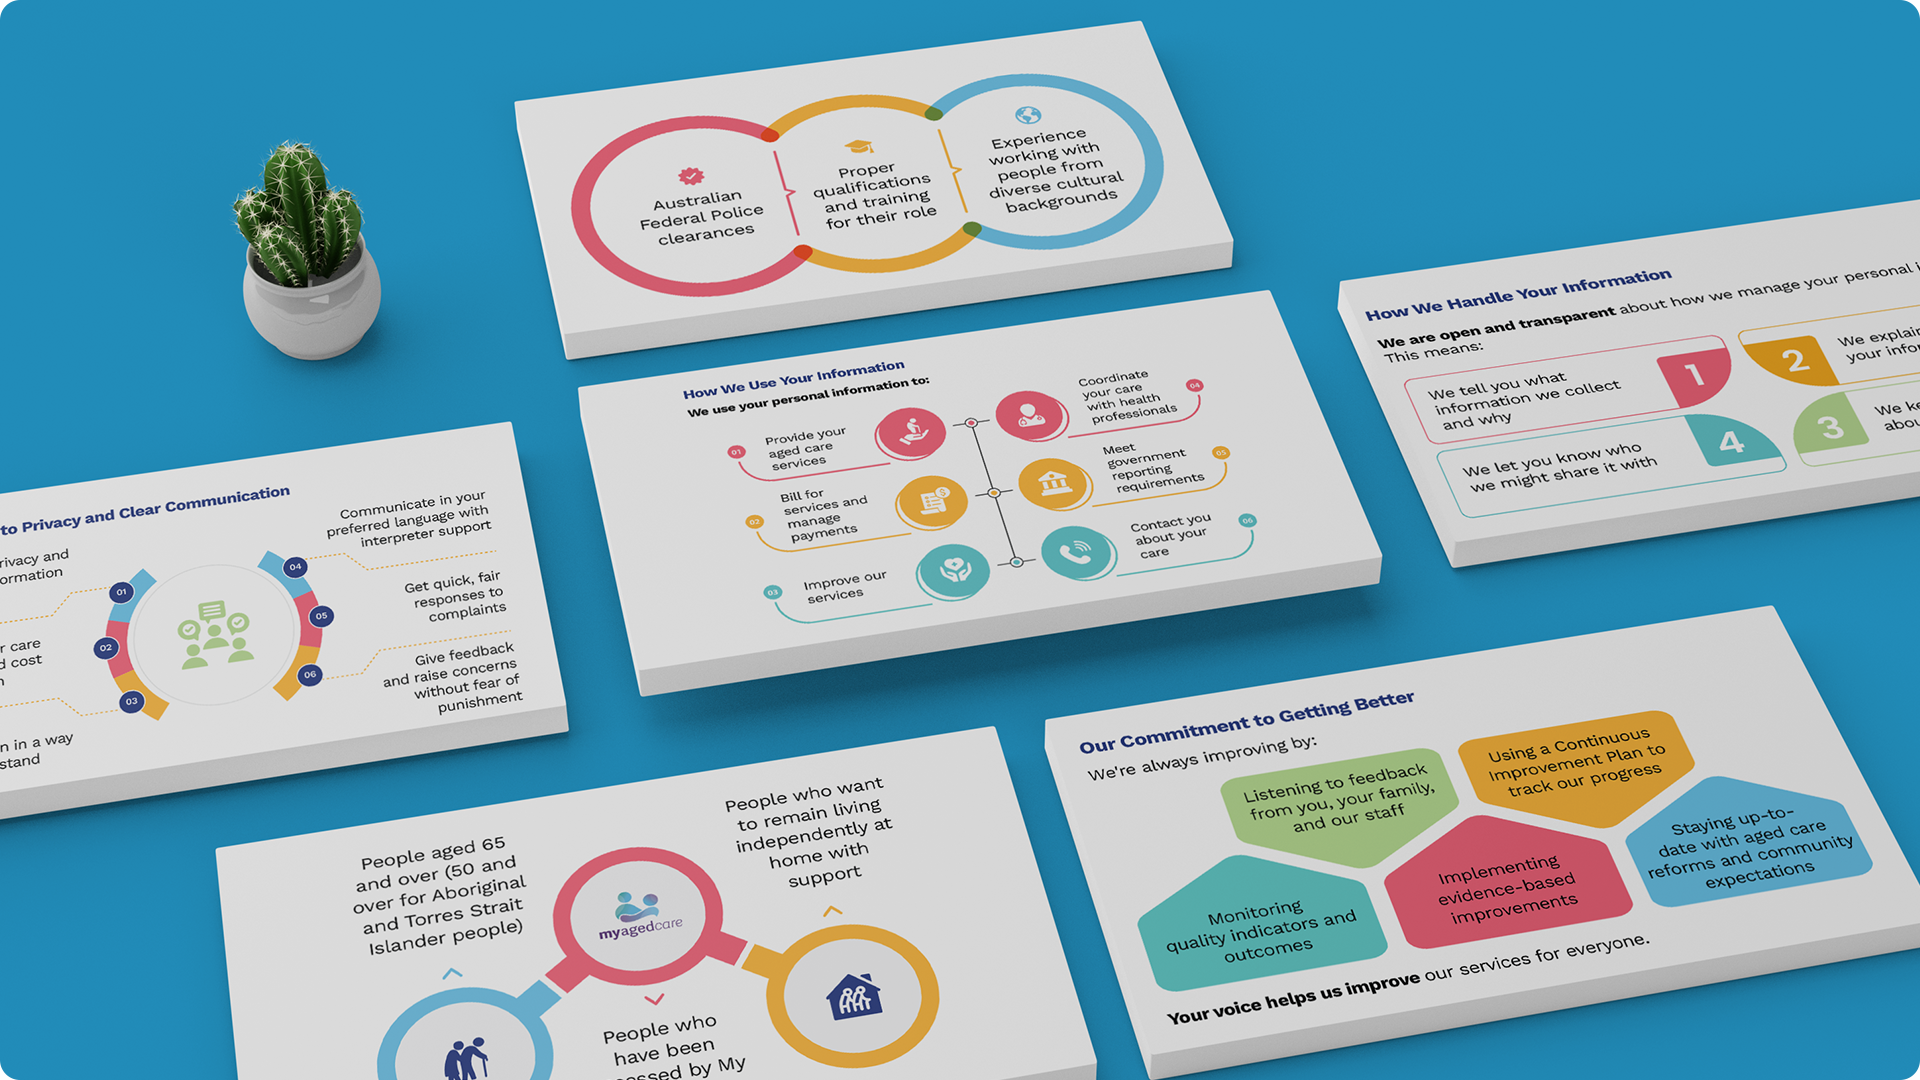
We don’t rely on generic stock icons. We build custom illustrations and data visualisations that fit perfectly within your existing visual identity.
Versatile Formats
Whether it’s a full-page spread for an annual report, a bite-sized social media post, or a slide for a boardroom pitch, we deliver optimised formats for every platform.
Can you share projects examples similar to what we need?
Visit our ‘Our Work’ page to see recent projects that show what we can do. We’ll also put together a proposal with examples that match your project and industry, so you know we’re the right fit.
Have you worked with clients in our industry?
We’ve worked with all kinds of clients—corporations, government, nonprofits, and startups—so we likely know your industry. We’re especially strong in corporate designs like annual reports, capability statements, and pitch decks, delivering results that make your brand stand out.
How is your pricing structured, and what does it include?
We price each project based on what you need. After a quick chat to understand your goals, we’ll send a clear proposal with costs, deliverables, and a timeline. We can adjust to fit your budget while keeping quality high.
What do you need from us to start a project?
We need a short brief about your goals, any brand guidelines, and assets like logos or content. We’ll walk you through anything else during our first meeting/phone call to make the start easy.
What’s your process for delivering a design project?
We start with a meeting/phone call to understand your goals. Within 2-4 business days, we’ll share initial designs for your feedback. It’s a team effort, and we keep it clear every step.
What if we don’t like the initial design concepts?
If the design isn’t right, no problem—we’ll listen to your feedback and create a new one. With hundreds of projects under our belt, we’re confident we’ll get it right. If you’re still not happy after the process, we won’t send an invoice.
How quickly can you deliver projects, and what are your typical timelines?
We can share first designs in 24–48 hours if you’re in a rush and finish projects in as little as 72 hours. But for the best results, we suggest 1–2 weeks to give you time to review and us time to refine. We only rush in emergencies to keep quality first.
How will you keep us updated throughout the project?
We keep you in the loop with emails at every step: when we start, share first designs (2–5 business days), review drafts (2–5 business days), make revisions (1–7 business days), and deliver the final files. You’ll always know what’s happening.
Who will be assigned to our project, and what’s their expertise?
You’ll work directly with our founders, Josh or Oscar, who each have over 10 years in marketing and design. They’ll guide your project and brief our talented designers to make sure your vision comes to life perfectly.